Overview
What it is
The Overview page is the analytics dashboard for your pipeline outcomes.
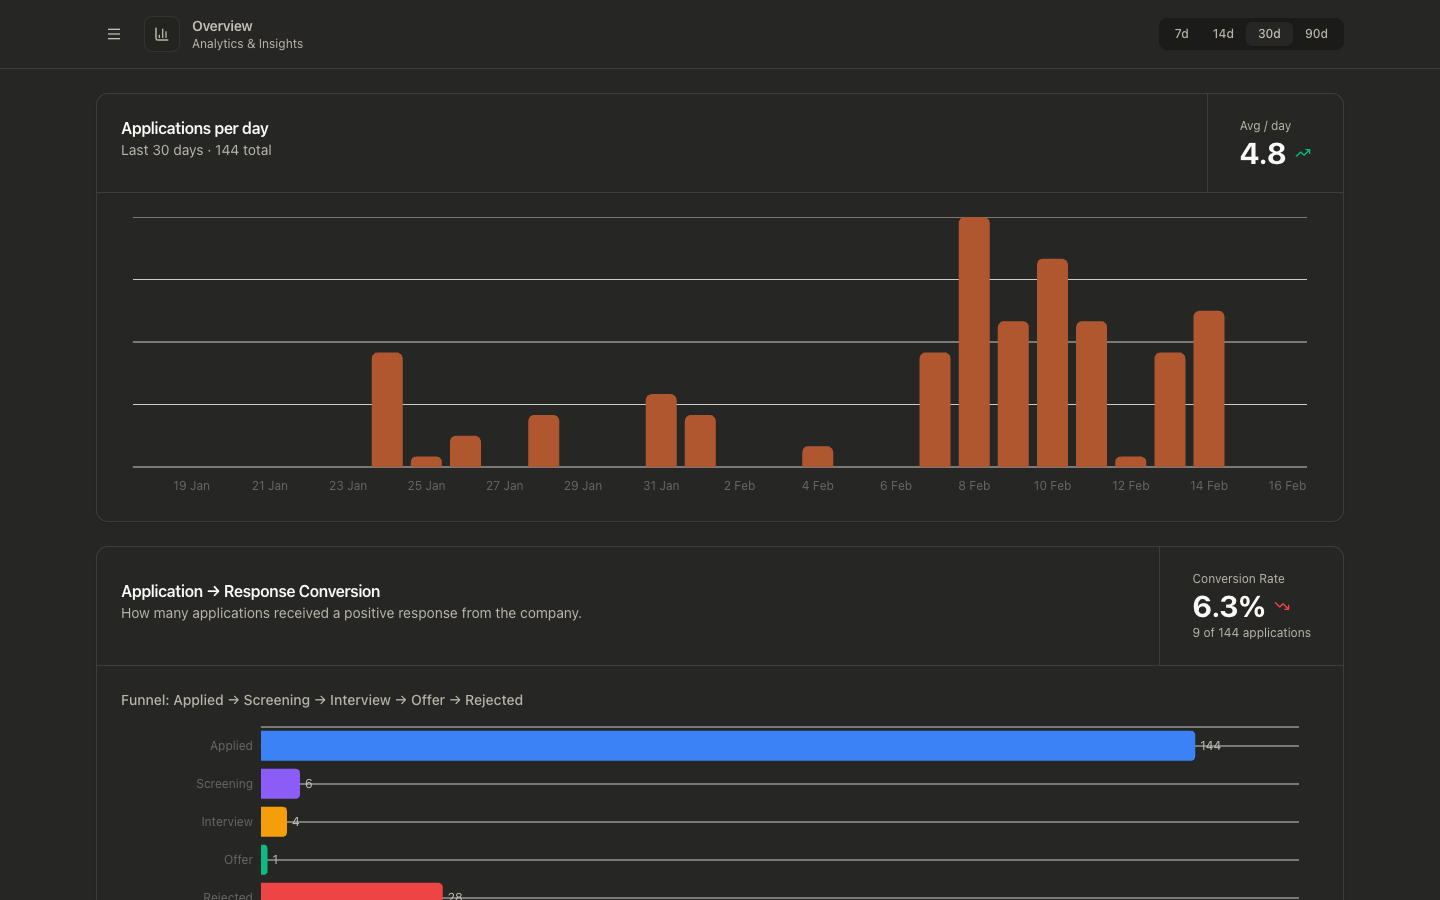
It visualizes:
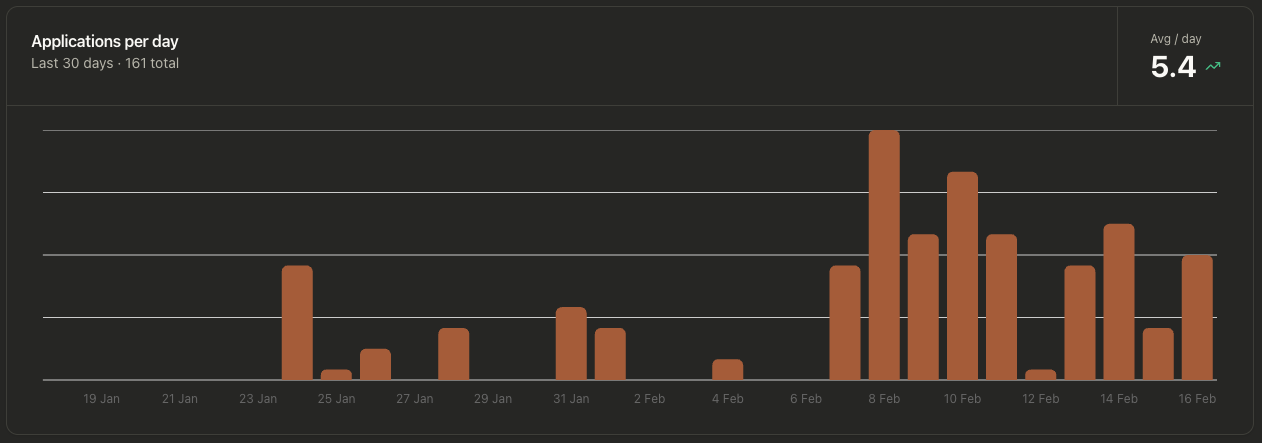
- Applications per day
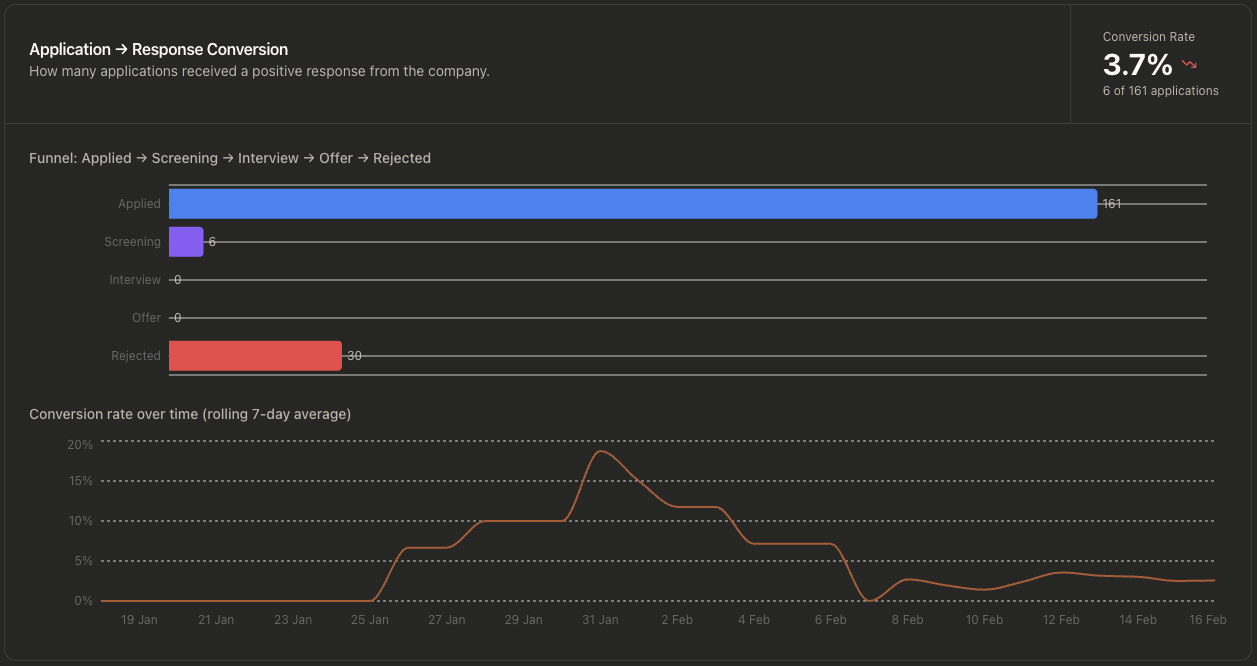
- Application-to-response conversion
- Funnel progression (Applied, Screening, Interview, Offer, Rejected)
Graph-level views
Why it exists
The page helps you measure whether your current sourcing and tailoring approach is producing responses, not just applications.
Use it to quickly answer:
- Are application volumes increasing or dropping?
- Is response conversion improving?
- Where are applications stalling in the funnel?
How to use it
- Open Overview.
- Select a time window (
7d,14d,30d,90d) in the top-right selector. - Review:
- Applications per day for volume trend
- Application → Response Conversion for quality/outcome trend
- Compare periods and adjust your sourcing terms, filters, or tailoring strategy.
Data and calculation defaults
- Default window is
30d. - Only jobs in statuses
appliedandin_progressare used as input. - Conversion counts any positive response-stage event (for example recruiter screen, assessment, interview stages, or offer).
- Conversion trend chart uses a rolling window up to 7 days.
Common problems
Empty charts
- Verify you have jobs with
appliedAttimestamps. - The selected duration may exclude your recent activity.
Conversion appears low
- Conversion only counts jobs that reached response stages.
- If stage events are missing or delayed, conversion will under-report.
Trend icons look counterintuitive
- Volume trend compares first-half vs second-half averages in the selected window.
- Changing the time window can materially change trend direction.